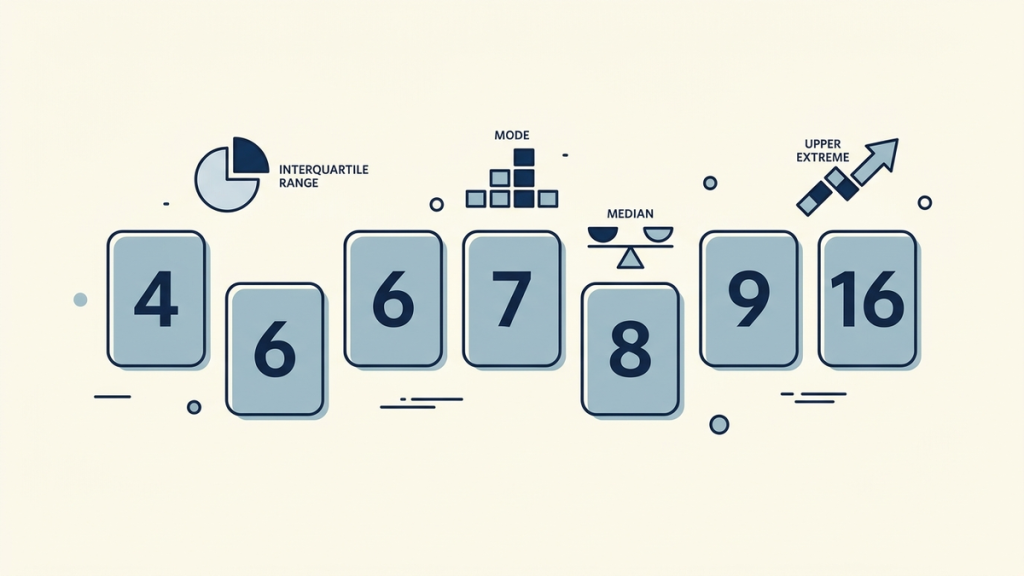
Seven customers waited 4, 6, 6, 7, 8, 9, and 16 minutes. What was a typical wait? You could answer 8 minutes, 7 minutes, or 6 minutes, depending on what you mean by “typical.”
Those answers are the mean, median, and mode. The range answers a different question: how far apart were the shortest and longest waits? We will use this one dataset to calculate all four measures and explain when each is useful.
Meet the dataset
Here are the values in ascending order:
4, 6, 6, 7, 8, 9, 16
There are seven observations. Count the repeated 6 twice because it represents two customers. A repeated value is still a separate observation, not something to delete before calculating.
The OpenStax explanation of measures of center distinguishes the mean, median, and mode as different summaries. The calculations below show why they need not agree.
Mean: share the total equally
Imagine putting all seven waiting times into one total, then sharing that total equally among the seven customers.
Total = 4 + 6 + 6 + 7 + 8 + 9 + 16 = 56 minutes
Mean = 56 / 7 = 8 minutes
The mean uses every value. It is the arithmetic average people usually intend when they say “add the numbers and divide by how many there are.”
The answer does not have to be one of the observed values, although 8 happens to appear in this dataset. If the total had been 57, the mean would have been 57/7, or approximately 8.14 minutes.
Common mistake: dividing by six because there are only six different numbers. The number of observations is seven, including both sixes.
Median: stand in the middle
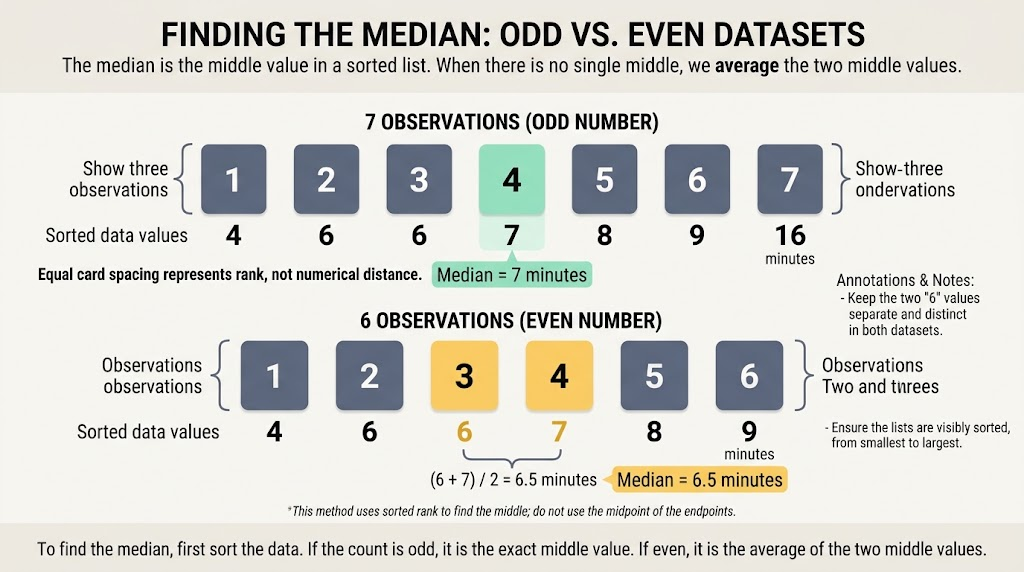
The median is the middle value after sorting. With seven observations, the middle position is (7 + 1)/2 = 4.
Positions: 1 2 3 4 5 6 7
Values: 4 6 6 7 8 9 16
^
median
The fourth value is 7 minutes. Three observations lie before it, and three lie after it. For datasets with ties, values on either side can equal the median; the position rule still works.
Sorting matters. If these waits arrived in the order 16, 4, 9, 6, 8, 7, 6, the fourth item in that unsorted list would be 6. That would not make 6 the median. Always sort first.
What changes when there are an even number of observations?
As a variation, suppose the 16-minute observation has not yet been recorded. The six available values are 4, 6, 6, 7, 8, and 9. There are two middle positions: the third and fourth.
Their values are 6 and 7, so the median is (6 + 7)/2 = 6.5 minutes. Do not simply choose the lower or higher middle value.
Mode: look for the most frequent value
Count how often each waiting time appears:
|
Waiting time |
Frequency |
|---|---|
|
4 minutes |
1 |
|
6 minutes |
2 |
|
7 minutes |
1 |
|
8 minutes |
1 |
|
9 minutes |
1 |
|
16 minutes |
1 |
The mode is 6 minutes, because it occurs twice and every other value occurs once.
Mode describes repetition, not numerical size. The largest number, 16, is not the mode. Nor is the frequency of 2 the mode: two tells you how often the modal value occurs.
A dataset can have more than one mode when several values tie for the highest frequency. In a small school exercise where every value occurs once, “no mode” is the usual convention. Follow the convention specified by the course or worksheet.
Range: measure the distance between the extremes
The range is the maximum minus the minimum:
Range = 16 – 4 = 12 minutes
Do not subtract the smallest value from the mean. Do not count the number of integers between 4 and 16. Range is the difference between two observed endpoints.
Unlike the other three measures, range is not a measure of center. It describes spread, and it tells you nothing about how the observations are arranged between the extremes.
All four answers, together
|
Measure |
Answer |
What it tells you here |
|---|---|---|
|
Mean |
8 minutes |
Total waiting time shared equally |
|
Median |
7 minutes |
Middle wait in sorted order |
|
Mode |
6 minutes |
Most frequently observed wait |
|
Range |
12 minutes |
Gap between shortest and longest waits |
There is no contradiction in these answers. Each calculation asks a different question of the same data.
Change one wait and see what moves
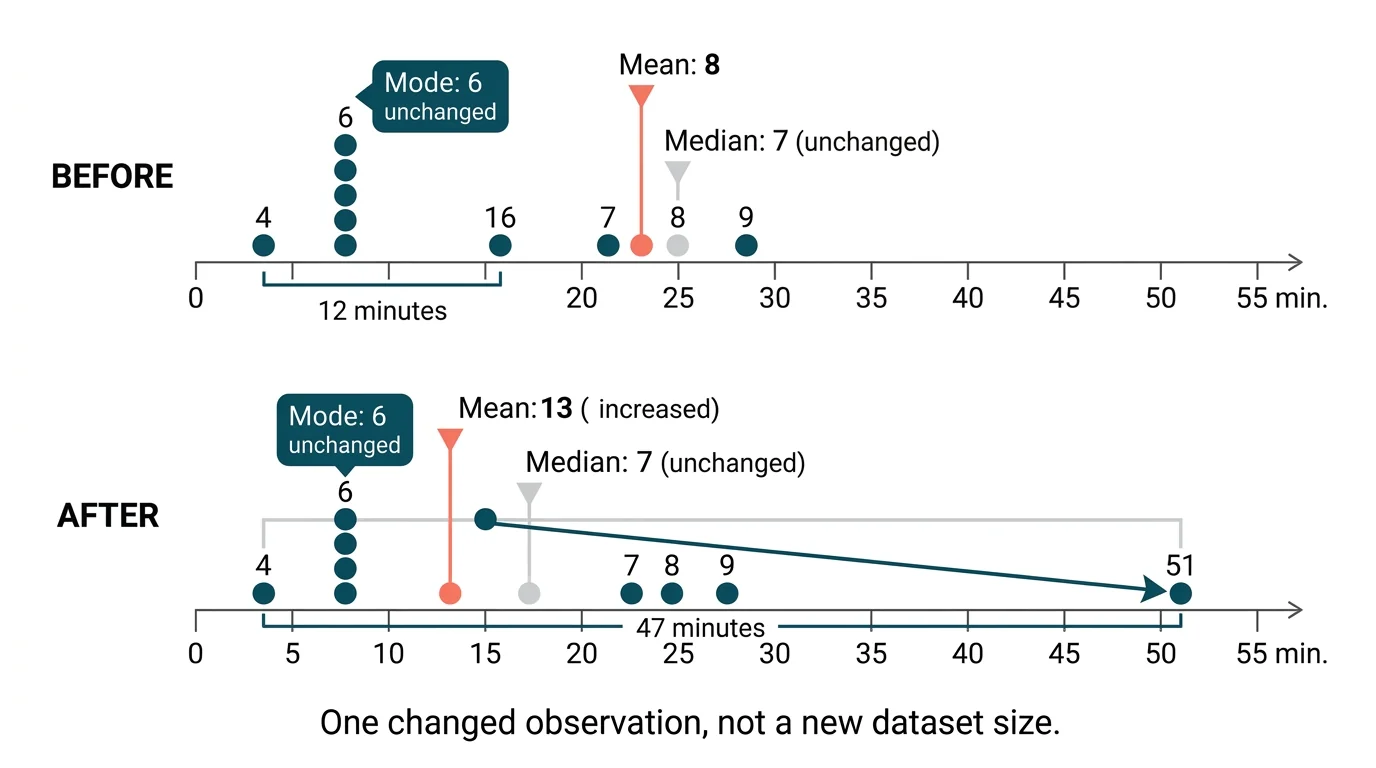
Now replace the longest wait, 16 minutes, with 51 minutes. Keep the other six observations unchanged:
4, 6, 6, 7, 8, 9, 51
The total rises from 56 to 91. The mean becomes 91/7 = 13 minutes. The median is still the fourth value, 7 minutes. The mode remains 6 minutes. The range becomes 51 – 4 = 47 minutes.
This experiment explains why a large outlier can make the mean feel unlike a typical experience. Most customers in the revised dataset still waited nine minutes or less, but the mean is 13.
That does not make the mean wrong. The very long wait contributes to the total and matters if you are studying the overall amount of waiting. The median answers a different question and is less affected by this particular change. The range reacts strongly because one endpoint moved.
Which number should you report?
For a quick description of the middle customer in this example, report the median and say how many observations you measured. For total-resource calculations, the mean may be more relevant. To describe a recurring value, use the mode. To show the observed extreme gap, add the range, ideally alongside a measure of center rather than on its own.
The NavigationHubs Average tool can check the mean of a numeric list. It does not calculate the median, mode, or range, so use the steps above for those measures.
A clear report could be: “Across seven observations, the median wait was 7 minutes, the mean was 8 minutes, and waits ranged from 4 to 16 minutes.” That gives the reader more context than a single unexplained “average.”